Debugging CC3D using GDB
GDB is useful when a CC3D simulation crashes in compiled C++ code. It can show the native call stack, the exact function where the crash happened, and the sequence of C++ calls that led to the failure. This is different from Python debugging: Python debuggers are useful for Python steppables and UI code, while GDB is for crashes in compiled libraries.
This page focuses on Linux. The same general idea can work on macOS, but
modern macOS systems usually use lldb instead of gdb because of
code-signing restrictions around GDB.
GDB Prerequisites
Before using GDB, make sure that:
CC3D runs from the command line in the conda environment you want to debug.
You are using the same compiled CC3D build that produced the crash.
The simulation can be launched from the command line.
GDB is installed in the active environment or available on your system.
For useful C++ source line information, build CC3D with debug symbols. A
RelWithDebInfo build is usually a good compromise because it preserves
optimization while keeping debug information. A pure Debug build may
be slower and can expose different timing behavior.
Check that GDB is available:
gdb --version
If you are using a conda-based development environment and GDB is not available, install it from conda-forge:
conda install -c conda-forge gdb
Start with a Command-Line Simulation
The simplest debugging target is cc3d.run_script because it runs a
simulation without the Player GUI. First verify that the simulation runs
normally from the active environment:
python -m cc3d.run_script -i ~/src-cc3d/CompuCell3D/CompuCell3D/core/Demos/Models/cellsort/cellsort_2D/cellsort_2D.cc3d
If the crash happens only in Player, you can debug Player instead, but
starting with run_script usually gives a cleaner stack trace.
Run cc3d.run_script under GDB
Start GDB with the Python interpreter from the active conda environment:
gdb --args python -m cc3d.run_script -i ~/src-cc3d/CompuCell3D/CompuCell3D/core/Demos/Models/cellsort/cellsort_2D/cellsort_2D.cc3d
At the GDB prompt, run the program:
(gdb) run
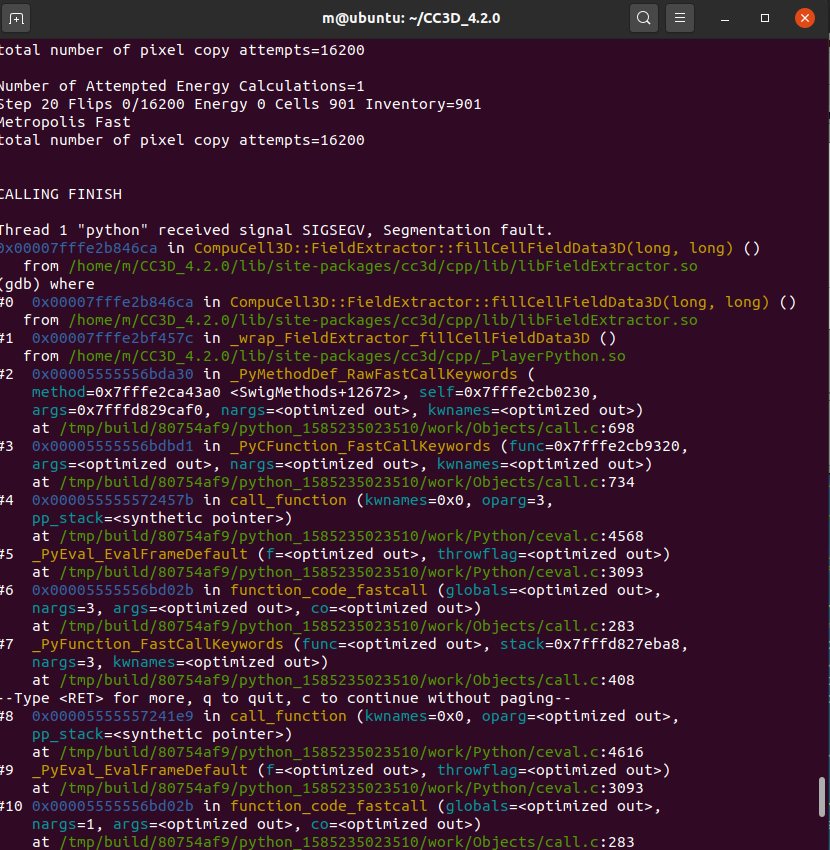
If the simulation crashes, GDB will stop at the crash site. Collect a native stack trace:
(gdb) where
For crashes involving multiple threads, collect stacks from all threads:
(gdb) info threads
(gdb) thread apply all bt
The where and bt commands both print backtraces. thread apply
all bt is often the most useful report to send to developers because
parallel Potts code and GUI code may involve more than one thread.
Debugging Player with GDB
If the crash requires the Player GUI, run Player under GDB instead:
gdb --args python -m cc3d.player5
Then start it from the GDB prompt:
(gdb) run
Open the simulation in Player and reproduce the crash. When GDB stops, collect the same information:
(gdb) where
(gdb) thread apply all bt
This approach avoids editing CC3D launcher scripts. It also makes it clear which Python executable and conda environment GDB is using.
Setting Breakpoints
You can set breakpoints before running the program. For example, to stop when the fast Metropolis loop starts:
(gdb) break CompuCell3D::Potts3D::metropolisFast
(gdb) run
If GDB cannot find the symbol before the CC3D libraries are loaded, allow pending breakpoints:
(gdb) set breakpoint pending on
(gdb) break CompuCell3D::Potts3D::metropolisFast
(gdb) run
You can also break on a source file and line number if debug symbols are available and the source paths match your build:
(gdb) break Potts3D.cpp:660
(gdb) run
Useful GDB Commands
Common commands during CC3D debugging are:
run # start the process
where # show the current thread's backtrace
bt # same idea as where
info threads # list threads
thread apply all bt # backtrace for every thread
frame 3 # select frame 3 from the backtrace
list # show source around the current frame
print variable_name # print a C++ variable if available
continue # resume after a breakpoint
quit # exit GDB
When reporting a crash, include at least:
the command used to start GDB,
the simulation file used to reproduce the crash,
the output of
whereorthread apply all bt,the CC3D branch or commit you built,
whether the build was
Release,RelWithDebInfo, orDebug.
When Source Lines Are Missing
If the stack trace shows function names but no source lines, the binary
probably does not contain debug symbols or GDB cannot find the source
files. Rebuild with debug information, preferably RelWithDebInfo, and
make sure you are debugging the same installed package that came from that
build.
If the stack trace contains mostly ?? frames, common causes are:
stripped binaries,
debugging a different CC3D installation than the one you built,
missing debug symbols for system or conda libraries,
optimized code in which some frames or variables were removed.
Even a partial native stack trace can still be useful, especially when it shows the CC3D function where the crash occurred.
macOS Note
On macOS, lldb is usually easier to use than gdb. The equivalent
pattern is:
lldb -- python -m cc3d.run_script -i path/to/simulation.cc3d
Then run and collect a backtrace:
(lldb) run
(lldb) bt all
The rest of the debugging idea is the same: start the active conda Python, reproduce the crash, and collect the native backtrace.
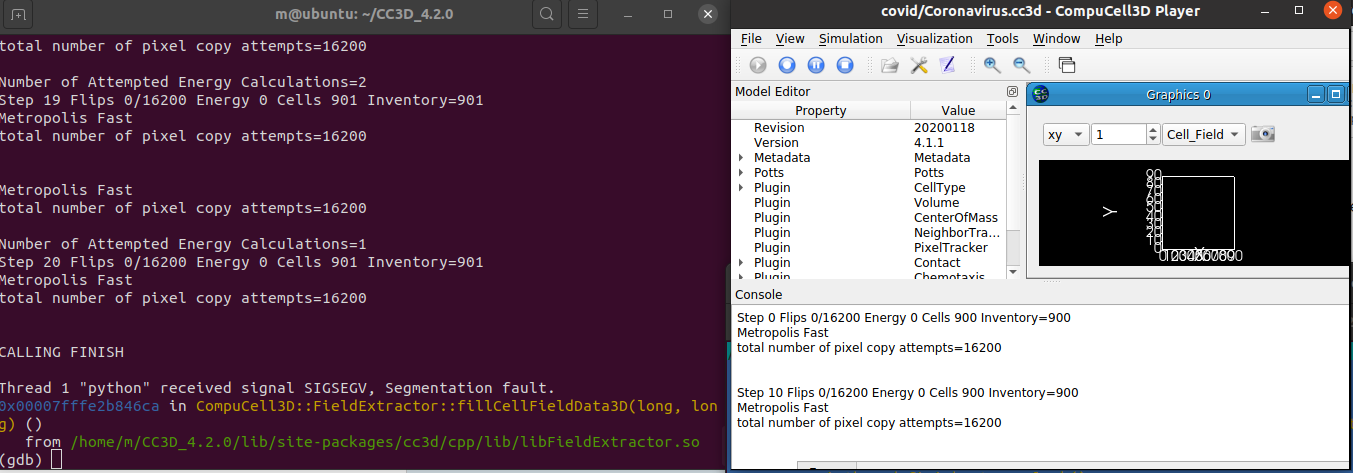
Example Screenshots
The screenshots below show an older workflow that launched GDB through a modified CC3D shell script. The command-line workflow above is preferred for new debugging sessions, but the screenshots still illustrate what a GDB session and backtrace look like.